Use Power BI semantic models in Excel for Dynamics 365 Business Central reporting
In Excel Desktop or Excel for the web, you can connect your Power BI semantic models for Dynamics 365 Business Central as a data source to build powerful reports about the state of your business. Perform ad-hoc analysis across functional areas, create refreshable reports, and take advantage of the versatility of Excel to make data-driven business decisions.
This article describes how to create Pivot Tables and Tables connected to Power BI Semantic Models from the Power BI apps for Dynamics 365 Business Central.
Getting Started
The following table includes links to help you get started with connecting to Power BI semantic models and use the data.
| To | See |
|---|---|
| Access Power BI semantic models in Excel | Connect Excel to Power BI semantic models |
| Create visuals in Excel using Power BI semantic models | Discover Power BI semantic models in Excel |
Example: Create a Table
This example uses the Inventory Power BI app for Business Central semantic model to illustrate a Table that could be built to report on outbound Lots.
On the Data tab in Excel Desktop, select Get Data > Power Platform > From Power BI.
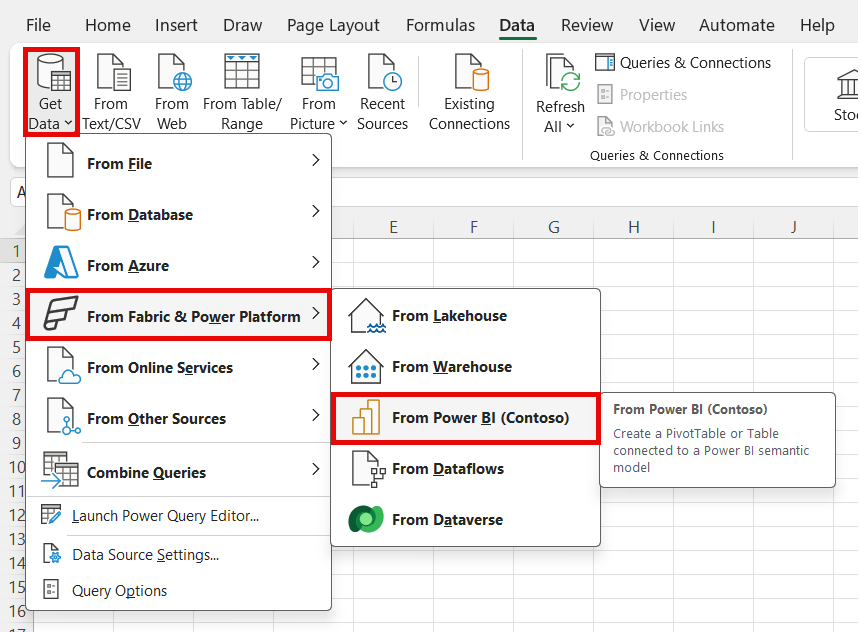
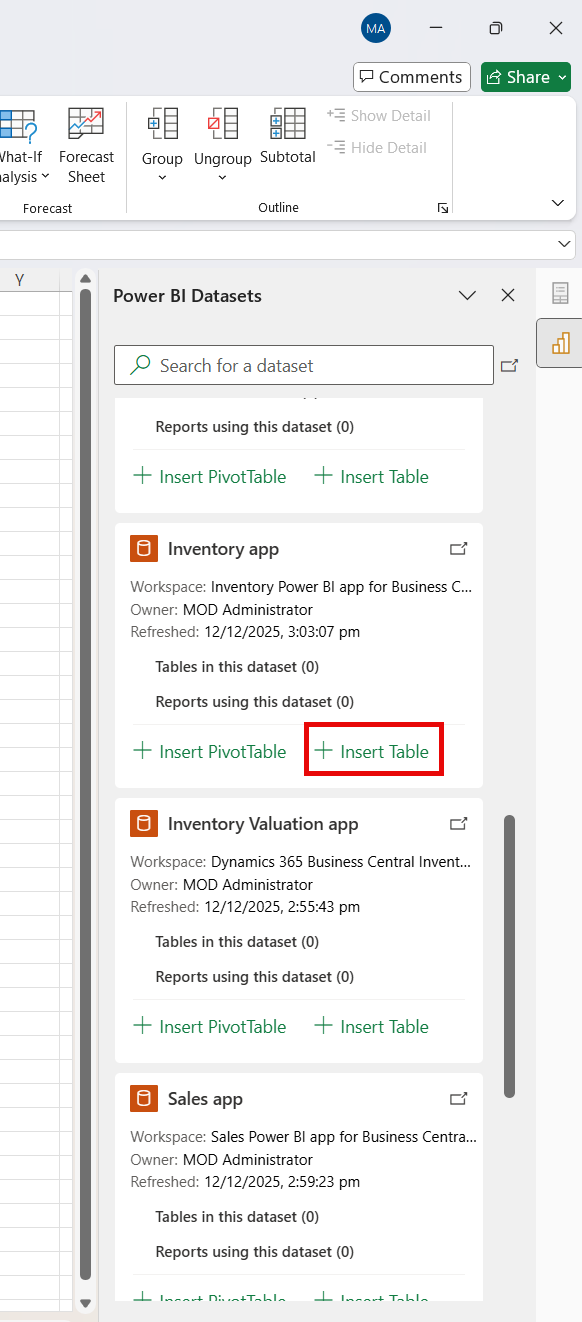
After you select From Power BI using either of these options, a pane opens on the right of the screen that shows Power BI semantic models you have access to. Select Insert Table for the Inventory app semantic model.
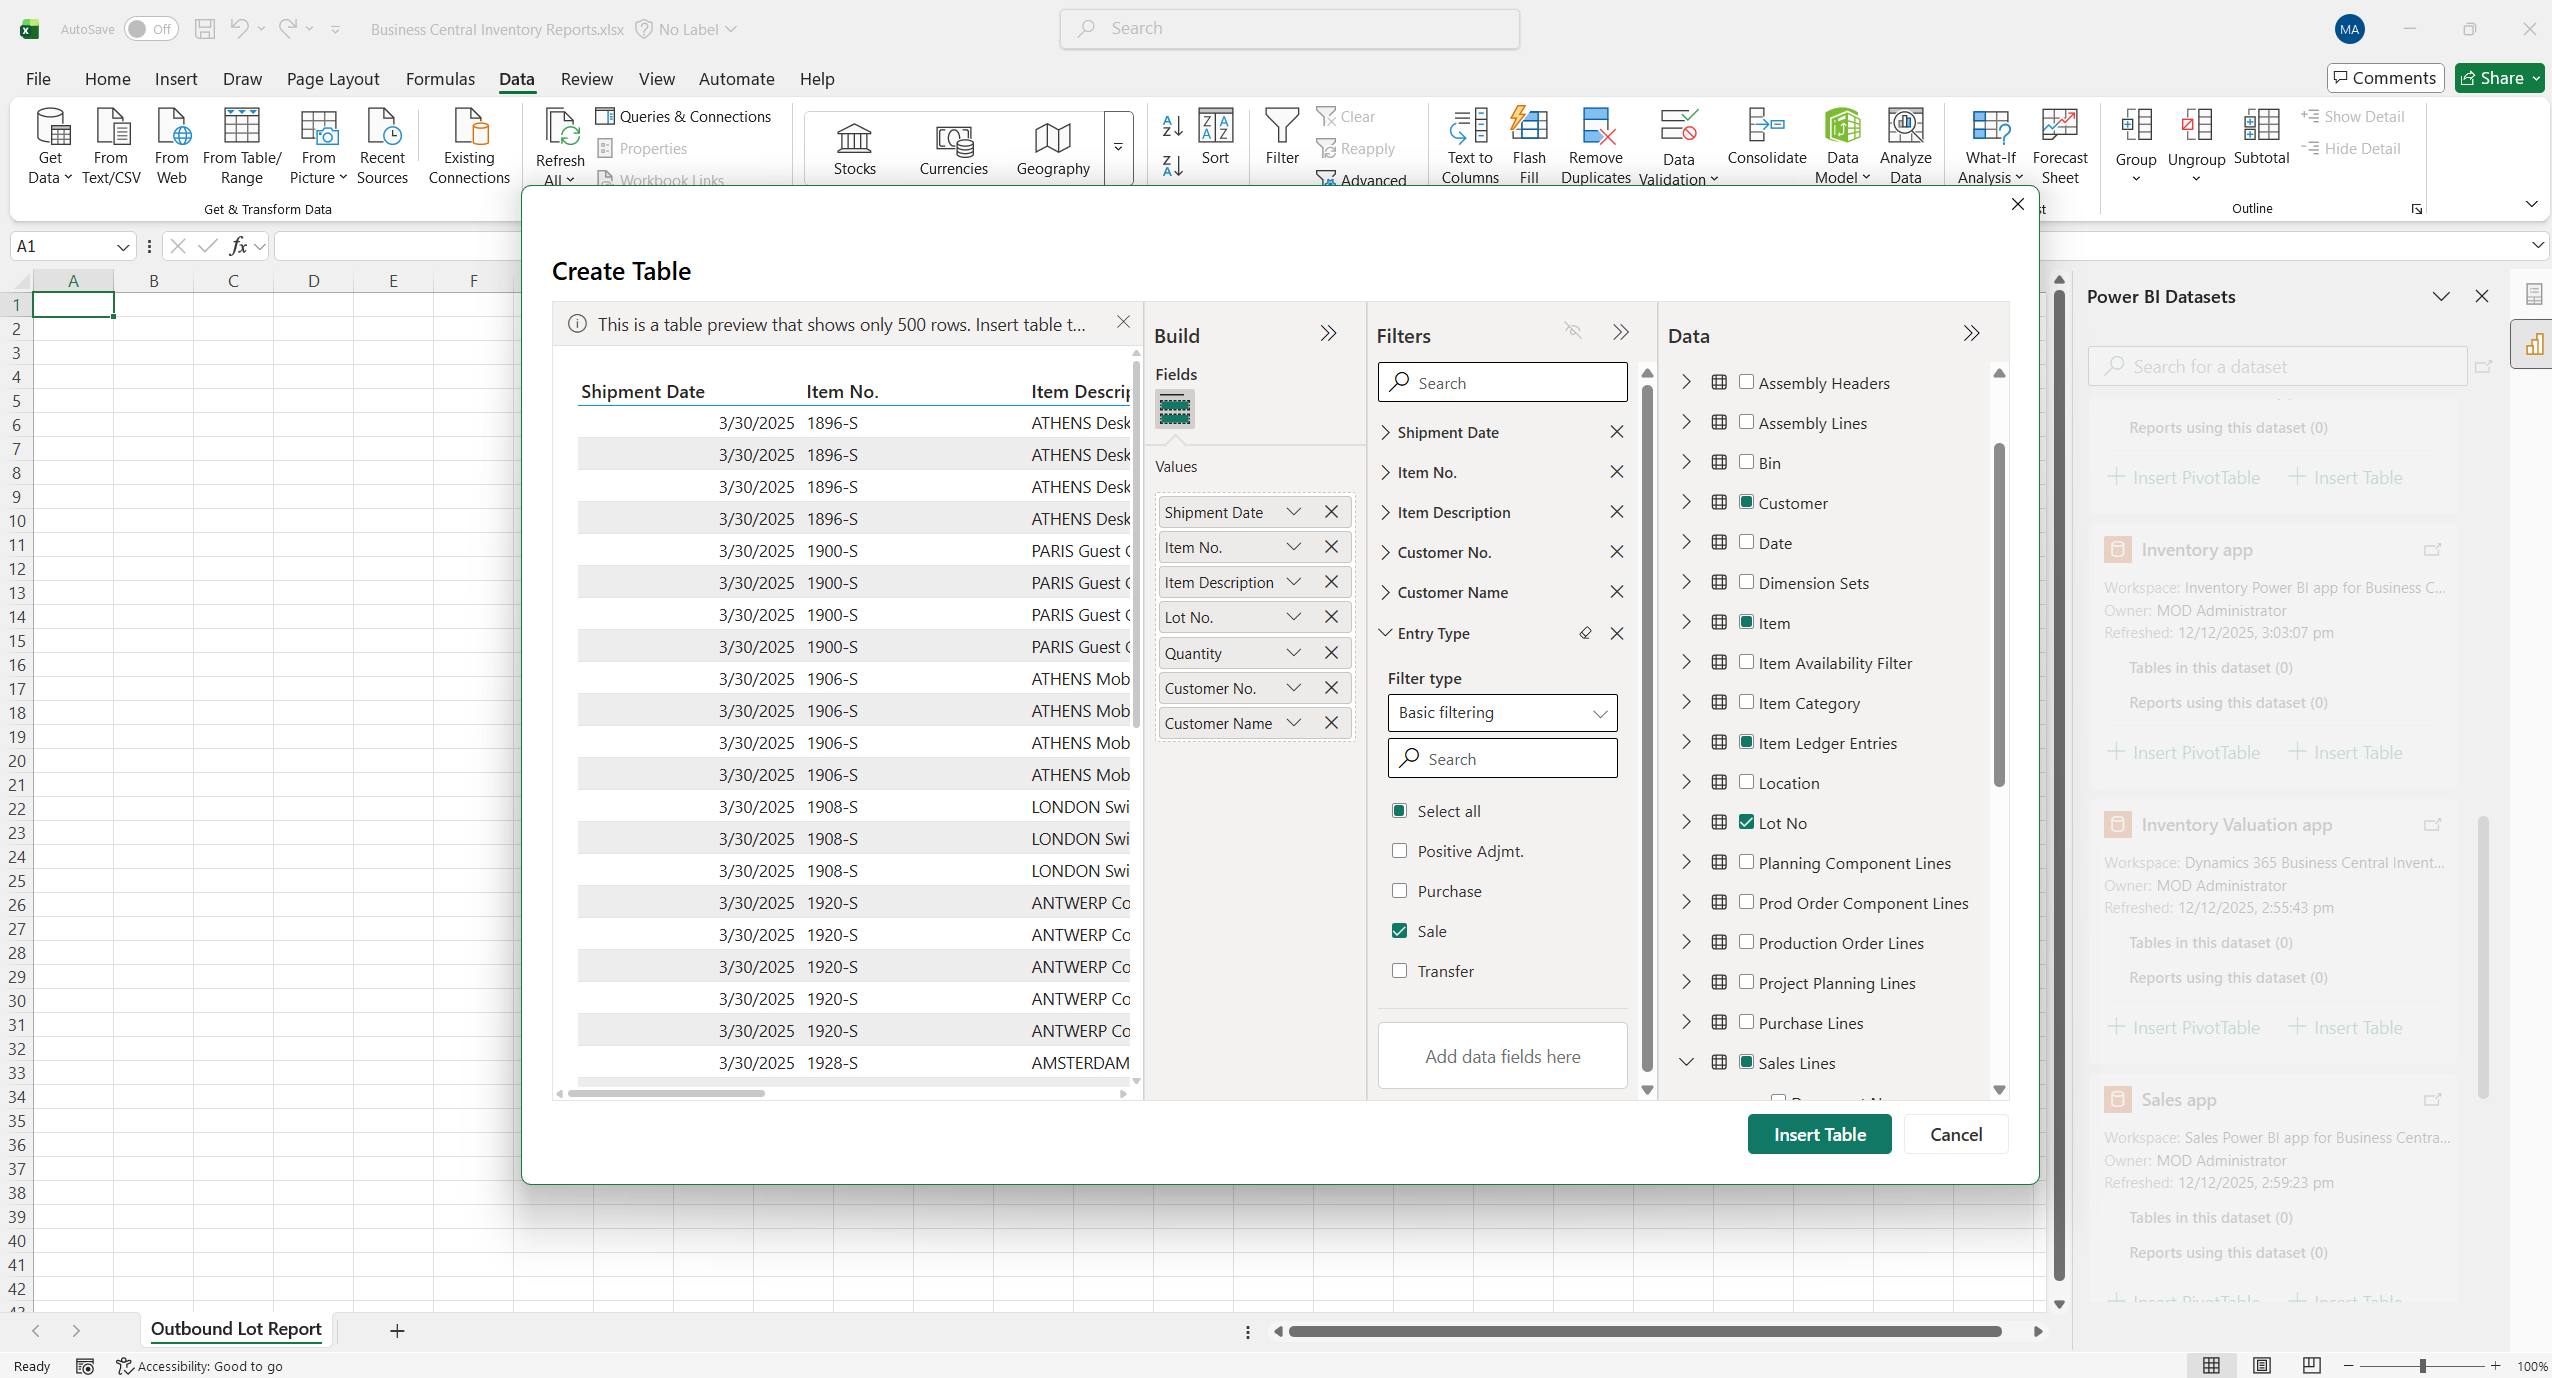
When you select Insert Table, the Create Table dialog opens, where you can use the Data, Build, and Filters panes to design the table you'd like. The predefined relationships in the semantic model allow fields from different tables to be combined into one table.
For this example:
- Add the following fields to values section of the Build pane:
- Sales Line table - Shipment Date
- Item table - Item No.
- Item table - Item Description
- Lot No. table - Lot No.
- Customer table - Customer No.
- Customer table - Customer Name
- Measure - Quantity
- In the Filters pane, filter for:
- Item Ledger Entrt table Entry Type = Sale
- Lot No. table Lot No. does not equal blank
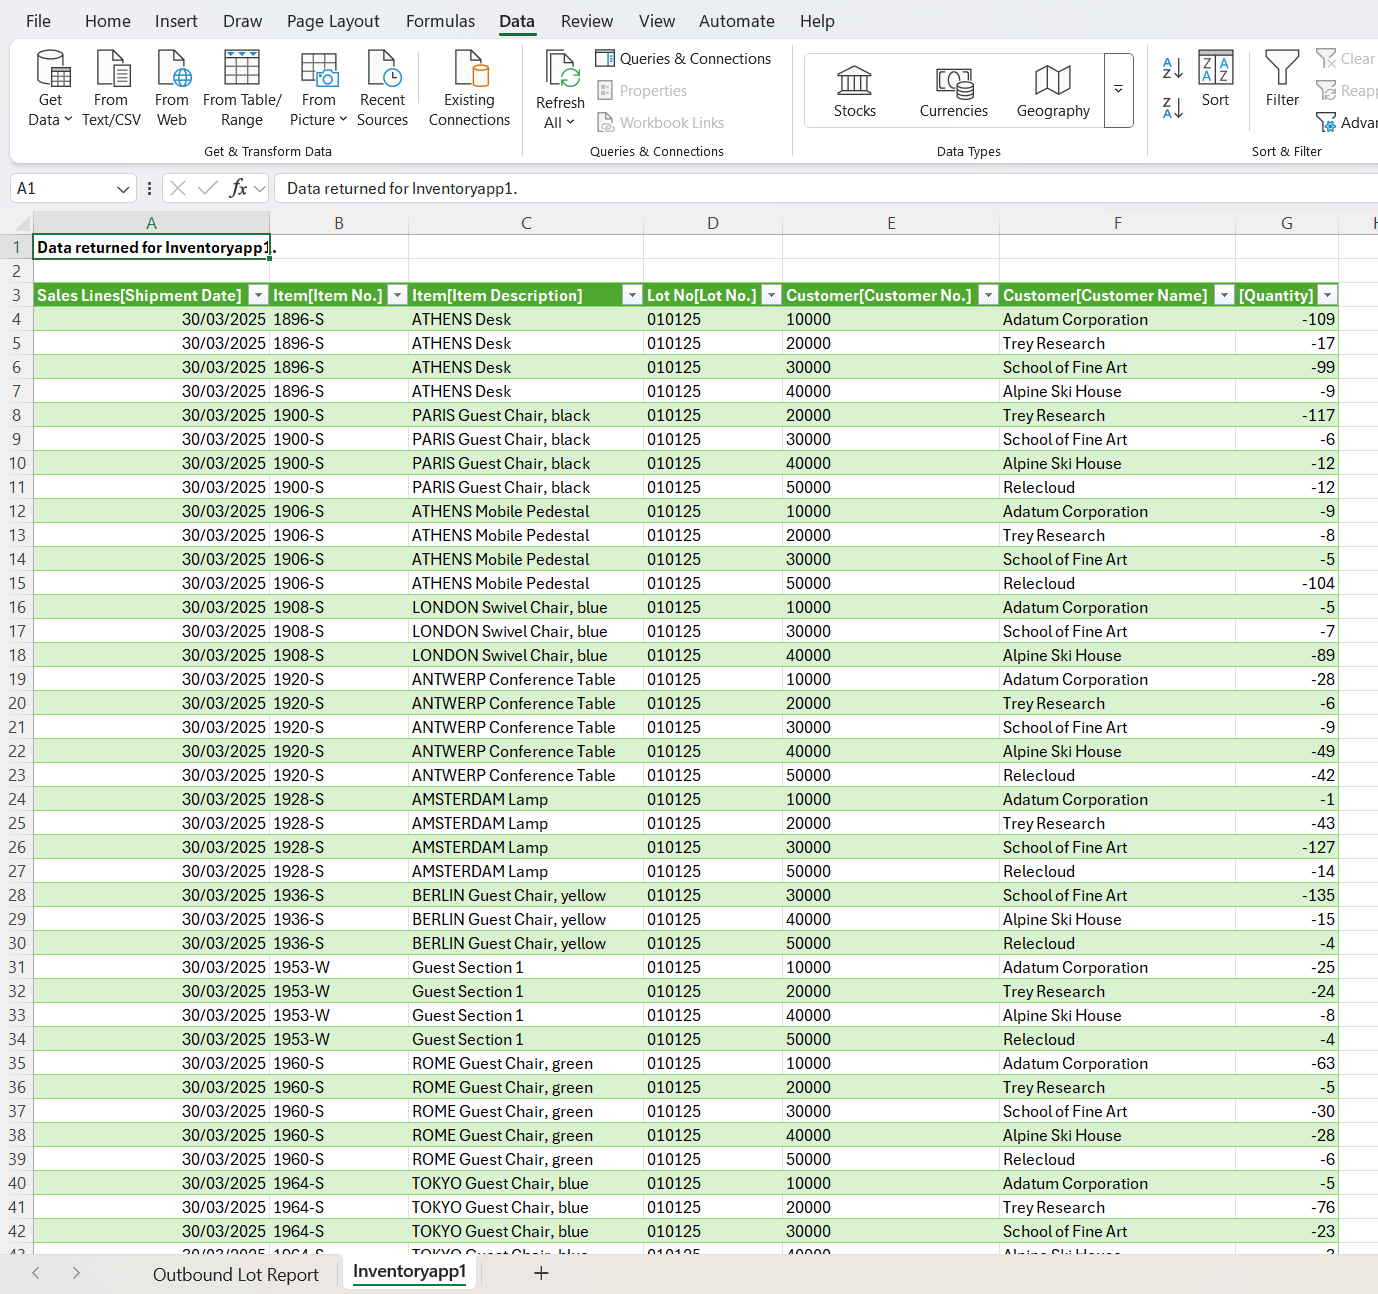
To add the table to the Excel sheet, use the Insert Table action in the dialog.
The resulting table can be interacted with, for example, to filter for a specific customer to determine which lots recently shipped.
Example: Create a Pivot Table
This example uses the Inventory Valuation Power BI app for Business Central semantic model to illustrate a Pivot Table that could be built to analyze inventory valuation by date.
On the Data tab in Excel Desktop, select Get Data > Power Platform > From Power BI.
After you select From Power BI using either of these options, a pane opens on the right of the screen that shows Power BI semantic models you have access to. Select Insert Pivot Table for the Inventory Valuation app semantic model.

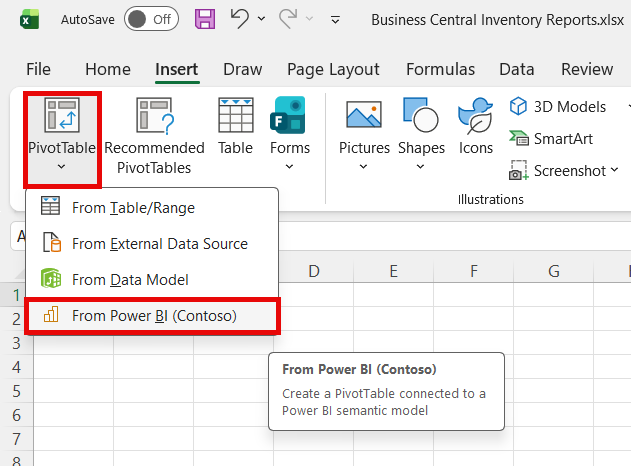
Alternatively, on the Insert tab in Excel, select PivotTable > From Power BI.
When you select Insert Pivot Table, the Pivot Table Field List pane opens in a new sheet. Drag fields to the Filters, Rows, Columns, and Values sections to design the Pivot Table you'd like.
For this example, add the following fields to various sections of the Fields pane:
- Add the following fields to the Filters section:
- Date table - Fiscal Year
- Date table - Fiscal Month
- Add the following fields to the Rows section:
- Measure - Valuation Date
- Item table - Item No. & Description
- Add the following field to the Values section:
- Measure - Increases Qty.
- Measure - Increases Value.
- Measure - Decrease Qty.
- Measure - Decrease Value.
- Measure - Cost Amount (Expected)
- Measure - Cost Amount (Actual).
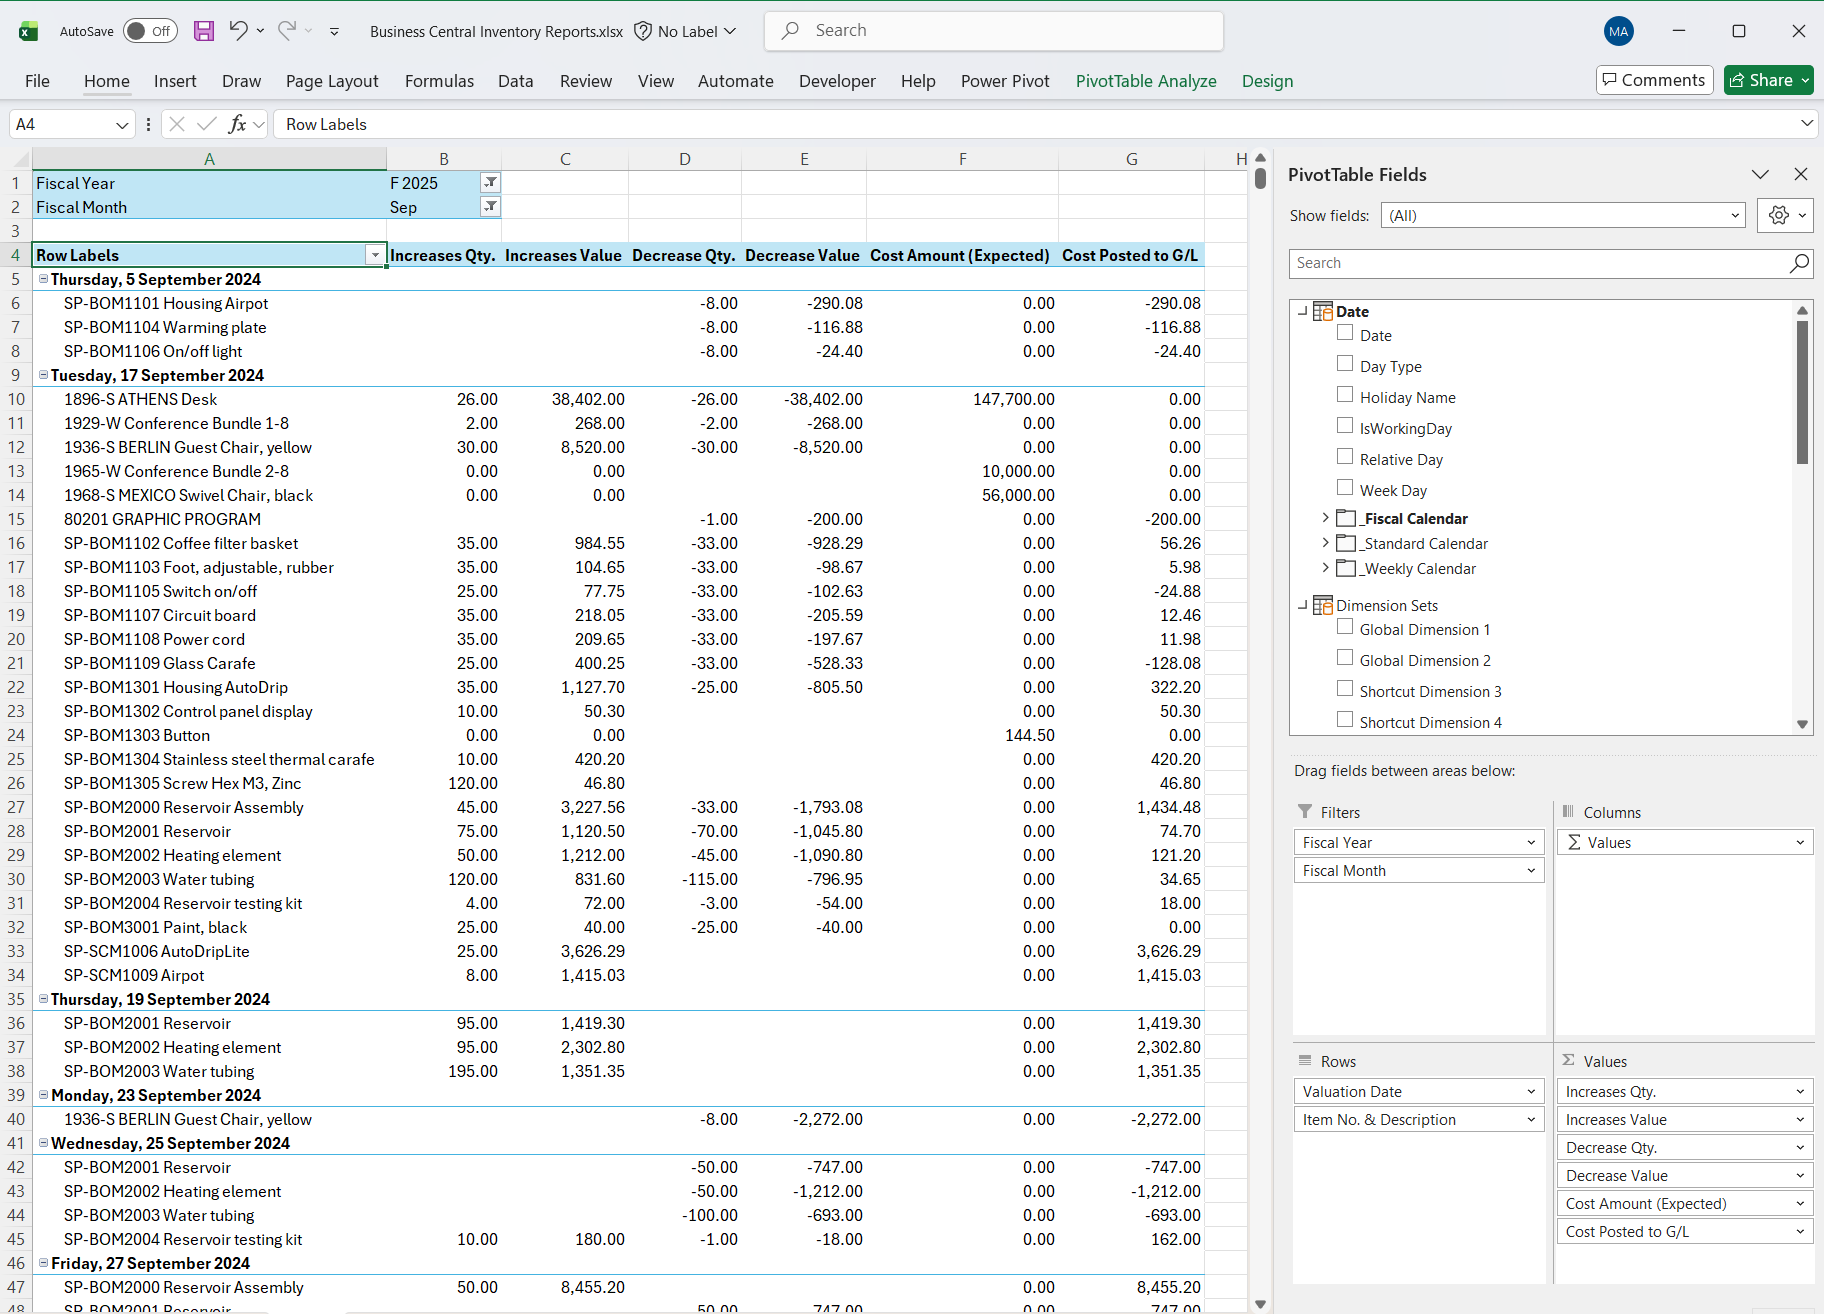
The resulting Pivot Table could be used to review activity on a date where a discrepancy has been identified between the standard Inventory Valuation Report and the inventory control accounts in the general ledger.
Example: Combining models with Power Pivot Excel add-in
This example uses the Inventory Power BI app for Business Central and the Sales Power BI app for Business Central semantic models to illustrate how to use the Power Pivot for Excel add-in to combine tables from multiple models into one Pivot Table.
Follow the steps from Example: Create a Table with the Inventory app model, including the following fields:
- Item table - Item No.
- Item table - Item Description
- Item Table - Item Replenishment System
Follow the steps from Example: Create a Table with the Sales app model, including the following fields:
- Item table - Item No.
- Salesperson Table - Salesperson Name
- Sales table - Document Type
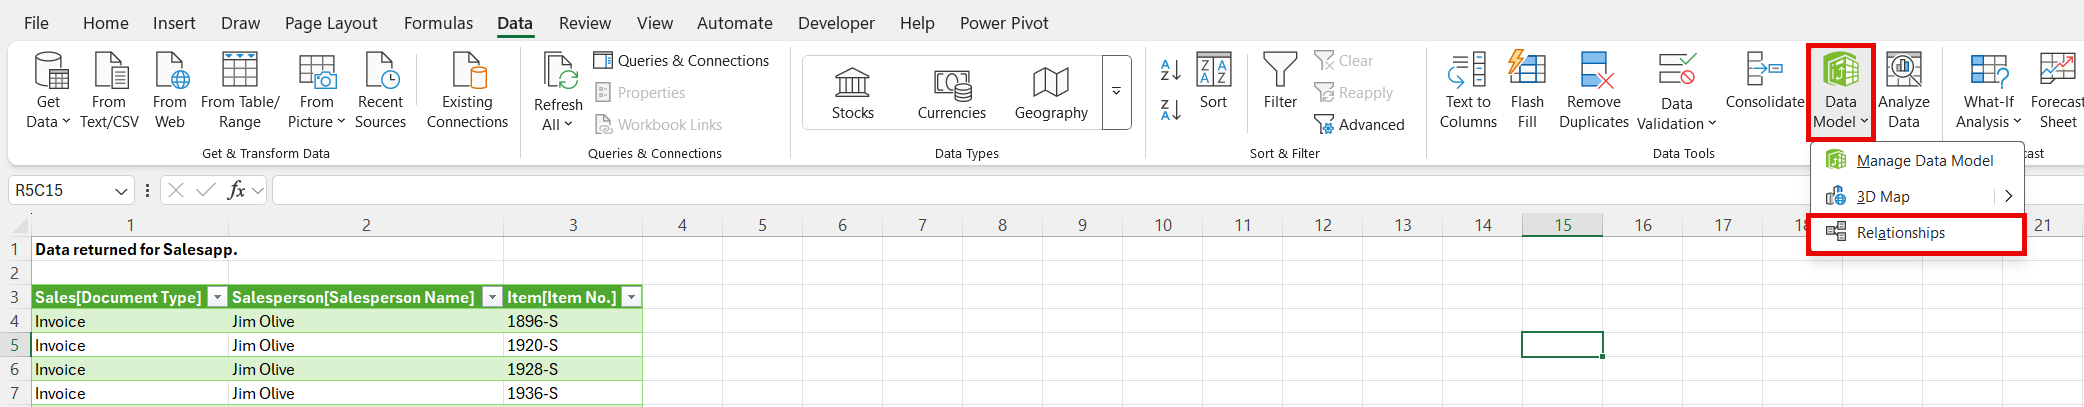
Go to Data > Data Tools > Data Model > Relationships.
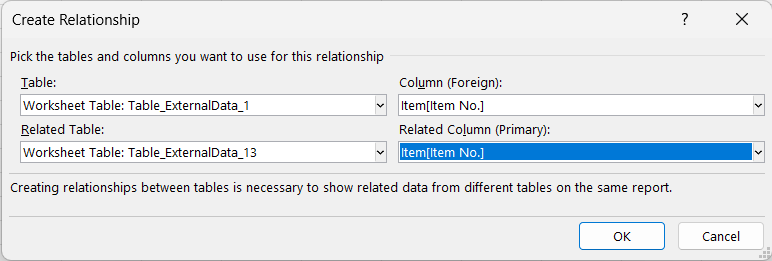
Define a relationship between the Sales & Inventory tables created in previous steps, based on the Item No. field.
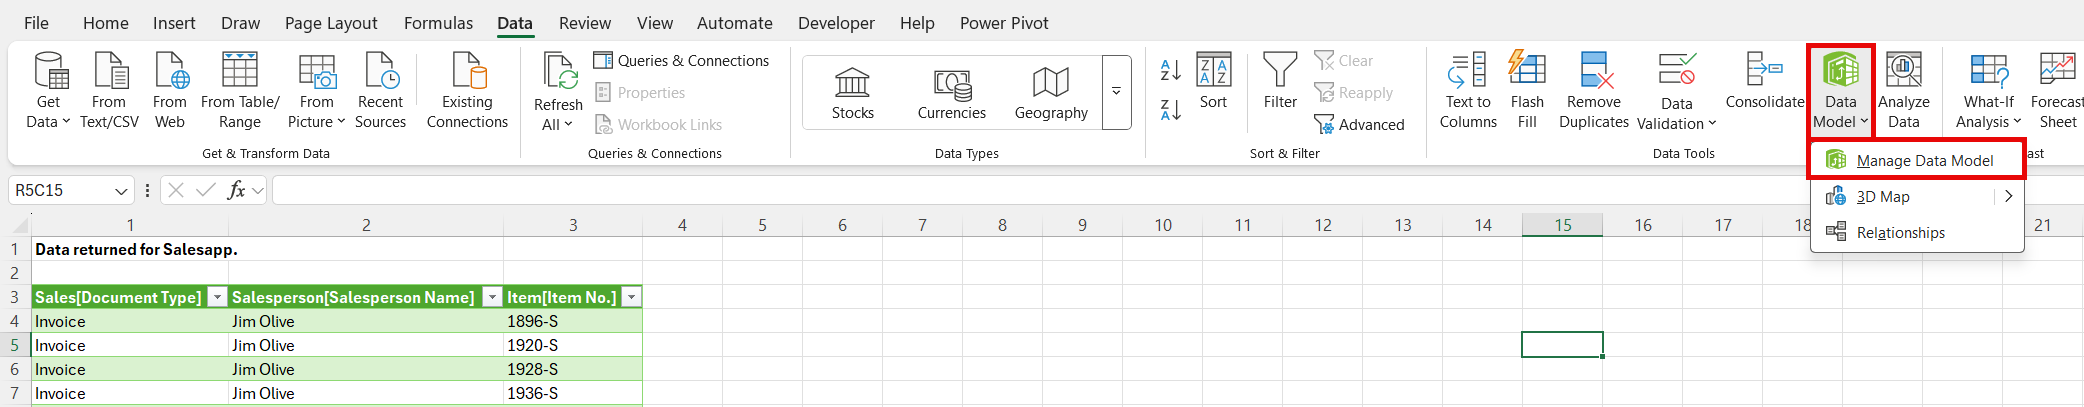
To open the Power Pivot model, choose to Data > Data Tools > Data Model > Manage Data Model.
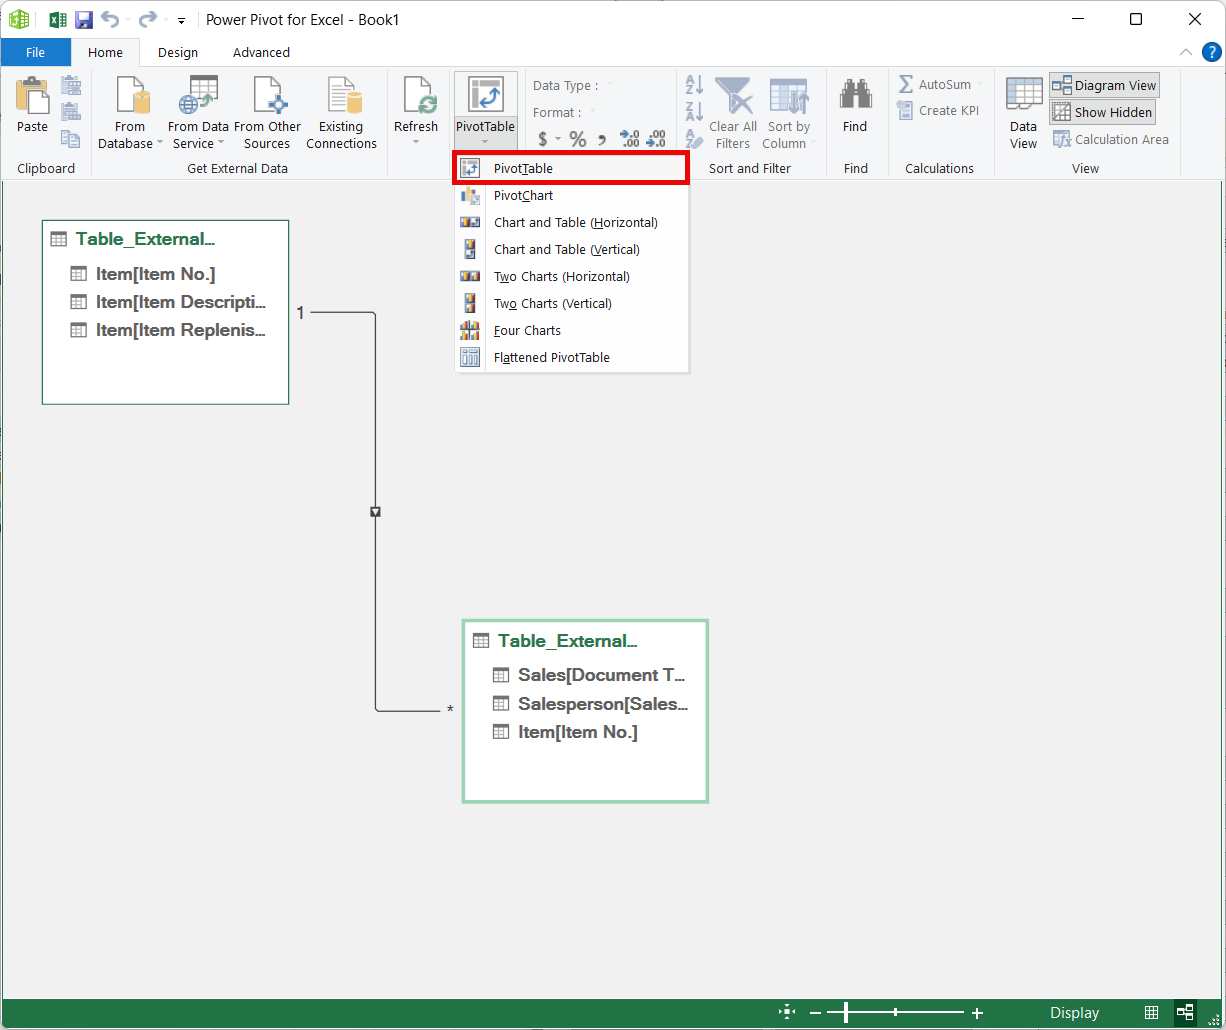
Review the created relationship in the Modelling view of Power Pivot. Create a Pivot Table to utilise the connection between the two tables.
For this example counting Item Sales for a Salesperson by Item Replenishment System:
- Add the following fields to the Rows section of the Fields pane:
- Salesperson table - Salesperson Name
- Item table - Item Replenishment System
- Add the following field to the Values section of the Fields pane:
- Item table - Item No.
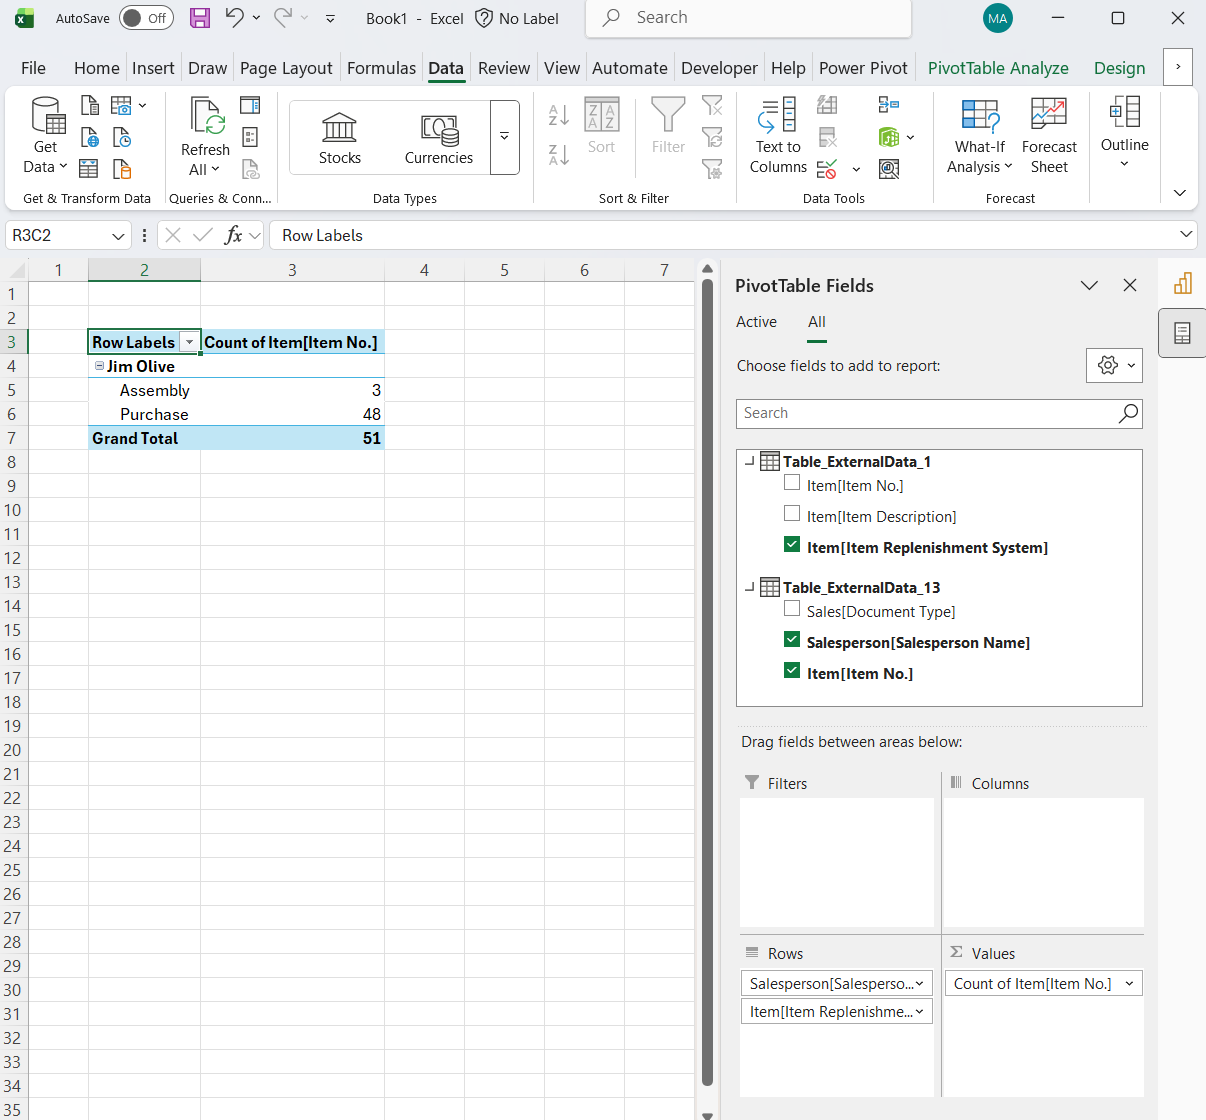
The resulting Pivot Table shows how we can connect Power BI semantic models within Excel to perform cross-functional reporting.
Related information
Install Power BI apps for Business Central
Power BI apps/reports for functional areas
Frequently asked questions about the Power BI apps in Business Central